Report
Contiple collects statistical data from consultation intake to resolution and provides various reports and analytics to help improve customer service quality.
➊ Period Statistics
1-1. Ticket
Provides a comprehensive dashboard with graphs showing the number of tickets processed by criteria, total processing time by criteria, and performance statistics by period.
① Daily Processed Cases/Daily Total Processing Time
View the number of processed tickets and total processing time by criteria based on the selected conditions.
The counts and times are aggregated only for Resolved and Pending tickets. (Tickets marked as Resolved Internally are excluded from aggregation.)
② Comprehensive performance statistics by period
ickets marked as Resolve Internally — including spam, abusive content, or test cases — are excluded from aggregation.
Field Description
Submitted Cases: Number of tickets received.
Processed Cases – Total: Number of tickets processed.
Processed Cases – Resolved: Number of tickets resolved.
Processed Cases – Pending: Number of tickets placed on hold.
Processed Cases – Others: Number of tickets internally resolved.
Processing Time (Total): Total processing time (Resolved + Pending + Internal).
Processing Time (Resolved + Pending): Total processing time for resolved and pending tickets.
Call – In: Number of tickets created from inbound calls.
Call – Out: Number of tickets created from outbound calls.
Call – Total (In): Total inbound call duration.
Call – Total (Out): Total outbound call duration.
Complete Cases: Number of tickets marked as completed.
Average Completion Time: Average time from initial submission to final completion.
1-2. Chat
Provides a comprehensive dashboard displaying chat consultation metrics, including the number of received and processed chats, processing and waiting times, and performance statistics by period.
(Chat Consultation) Give Up : Occurs when an agent does not click on or respond to a customer’s chat request in the waiting list.
(Chat Consultation) Processing : Occurs when an agent clicks on a customer’s chat request in the waiting list and sends a response.
① Reception and processing/Processing and waiting time
You can view the number of received and processed chat consultations, along with processing and waiting times, based on the selected conditions.
② Comprehensive performance statistics by period
Field Description
Incoming: Number of chat sessions started when customers click Start Chat in the chat widget.
Reception: Number of chats where customers actually submitted an inquiry to an agent after starting the session.
Give Up: Number of chat requests that agents did not respond to.
Processing: Number of chat requests that agents responded to.
Created Ticket: Number of chat consultations converted into tickets.
Total Waiting Time: Total waiting time (from the customer’s first inquiry submission to the agent’s first response).
Total Processing Time: Total processing time (from the customer’s first inquiry submission to the agent’s chat end).
Average Processing Time: Average duration of chat processing.
➋ Type Statistics
2-1. Ticket
Provides a dashboard displaying ticket metrics by reception type and processing type, including graphs for received and processed cases, processing time, detailed status by type, and processing activity within specific time intervals.
① Submission & Processing Case by Submission type/Processing time by Submission type
You can view the number of received and processed tickets, as well as processing times by reception type, based on the selected conditions.
The counts and processing times are aggregated only for Resolved and Pending tickets. (Internal Resolution tickets are excluded from aggregation.)
② Detailed processing status by submission type
Field Description
Submitted Cases: Number of tickets received.
Processed Cases – Sum: Total number of tickets processed.
Processed Cases – Resolved: Number of tickets resolved.
Processed Cases – Pending: Number of tickets placed on hold.
Processed Cases – Others: Number of tickets internally resolved.
Processing Time (Resolved + Pending): Total processing time for resolved and pending tickets.
Call – In: Number of tickets created from inbound calls.
Call – Out: Number of tickets created from outbound calls.
Call Time (In): Total inbound call duration.
Call Time (Out): Total outbound call duration.
Complete Cases: Number of tickets marked as completed.
Complete Time: Total completion time (from initial submission to final completion).
③ Processing status in time interval by submission type
Displays the processing status by reception type within each time interval, based on the selected time unit and end date.
Go to FAQ
2-2. Chat
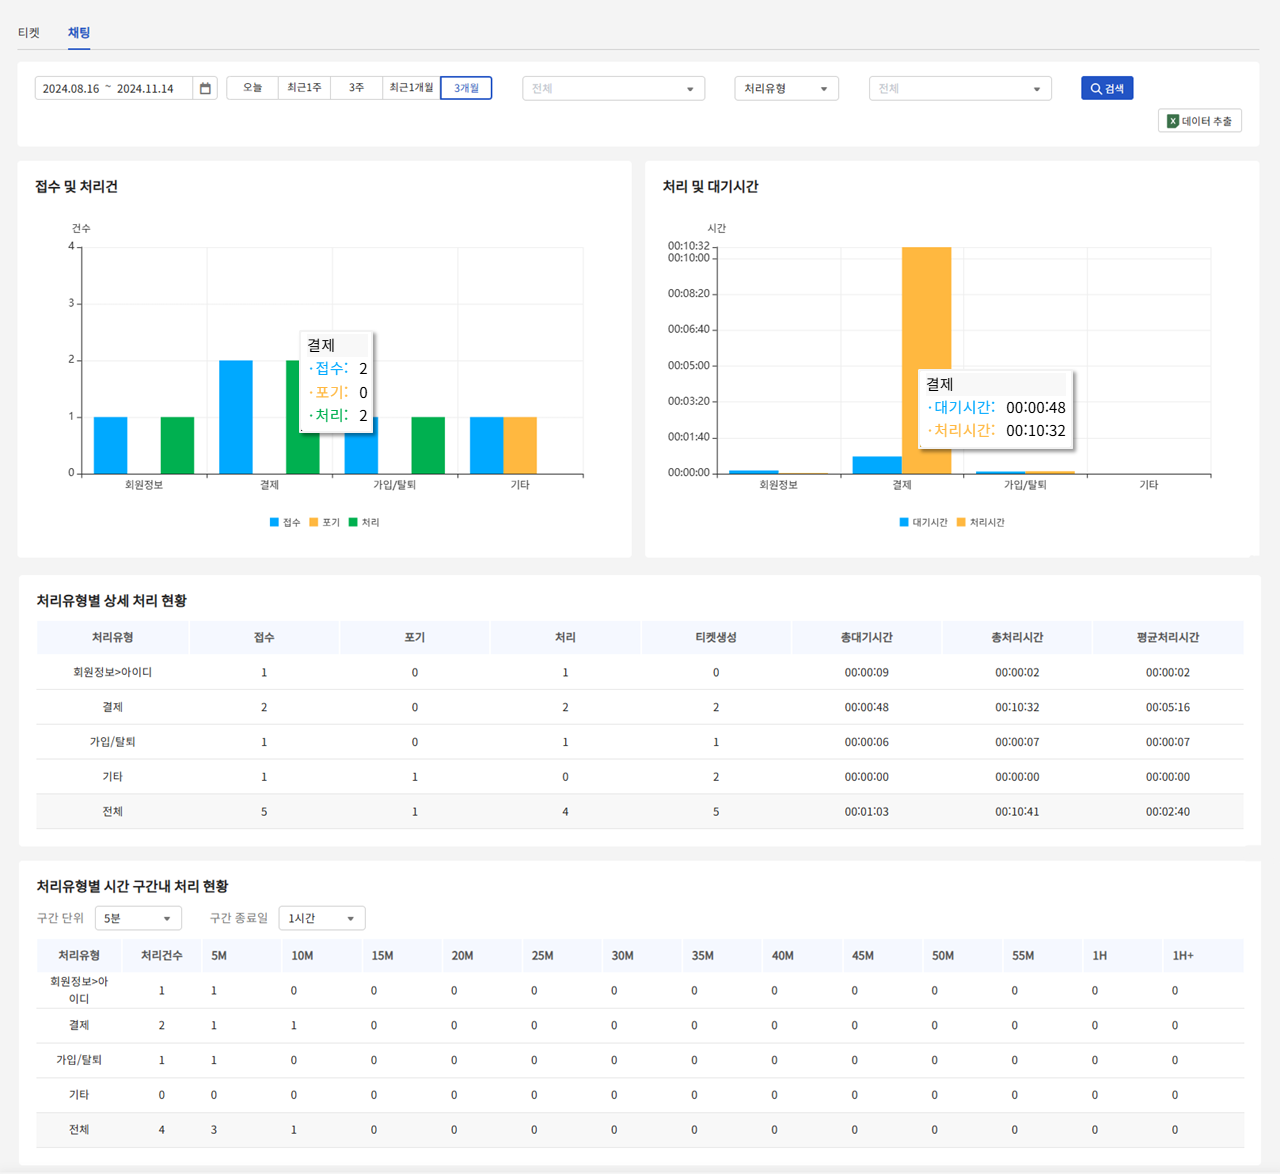
Provides a dashboard for chat consultations showing processing metrics by processing type, including the number of received and processed cases, processing and waiting time graphs, detailed processing status, and time-interval performance.

① o/처리 및 대기시간 그래프
설정한 조건에 따라 처리유형별 접수 및 처리 건, 처리 및 대기시간을 조회할 수 있습니다.
② 처리유형별 상세 처리 현황
설정한 조건에 따른 상담원별 상세 처리 현황 표입니다.
③ 처리유형별 시간 구간 내 처리 현황
설정한 조건에 따른 유형별 시간 구간 내 처리 현황 표입니다.
➌ Perforamance Statistics
This page provides agent performance statistics for both tickets and chat consultations. You can view statistical data by setting filters such as date range, channel, and view type (by Group or Agent).
3-1. Ticket
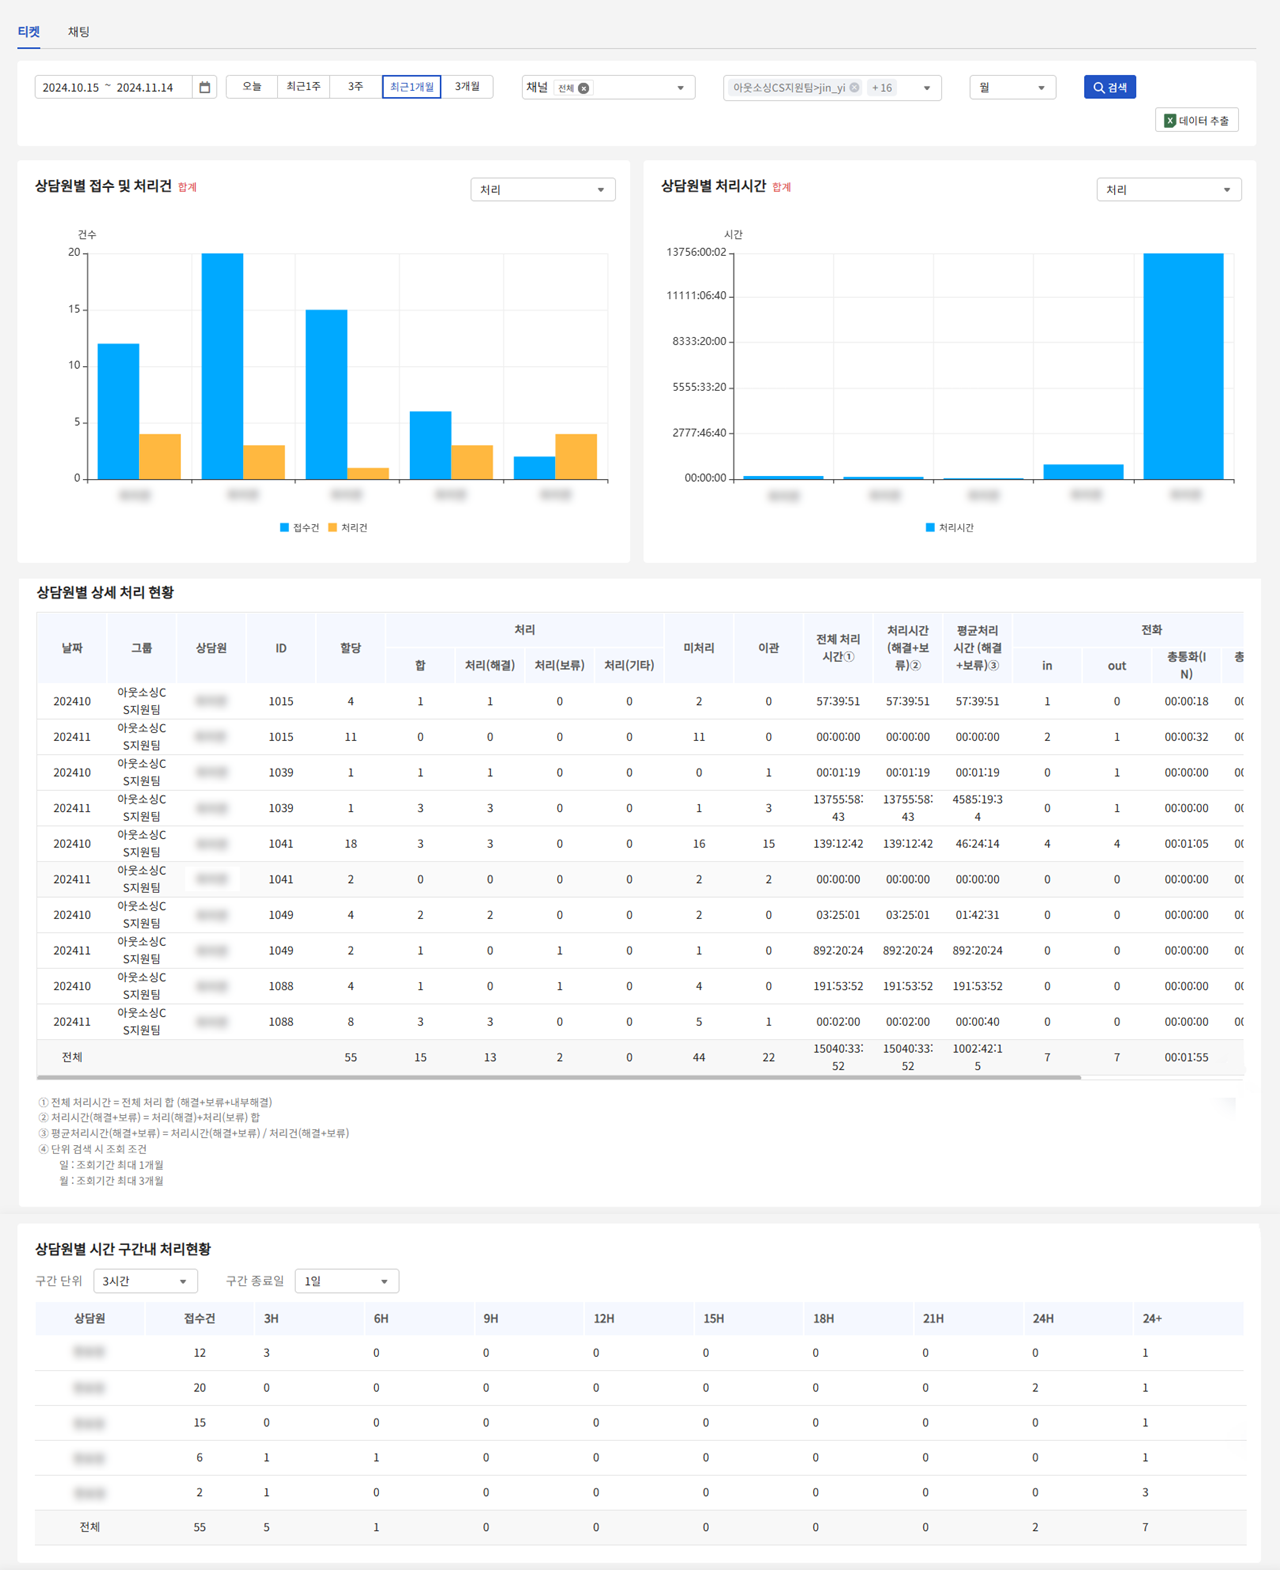
It displays each agent’s ticket intake and resolution counts, average handling time graphs, status breakdowns, and time-based performance tables.

① Received and Processed Cases / Processing Time by Agent
View the number of received and processed cases, as well as processing time by agent, based on the selected conditions.
Only Resolved and Pending tickets are included in the count. (Resolved Internally are excluded.) Hover over the data points to see detailed figures for each category.
② Detailed Processing Status by Agent
This table shows the detailed processing status by agent based on the selected conditions.
Tickets marked as Internal Resolution, such as spam, abusive language, or test cases, are excluded from the statistics.
Field Description
Assign: Number of tickets assigned to the agent
Processed - Sum: Total number of processed tickets
Processed - Processed (Resolved): Number of resolved tickets
Processed - Processed (Pending): Number of pending tickets
Processed - Processed (Other): Number of resolved internally tickets
Unresolved: Number of assigned tickets that are not resolved, completed, or pending
Escalated: Number of escalated tickets
Processing Time: Total processing time (Resolved + Pending + Resolved Internally)
Processing Time (Resolved+Pending): Total processing time for resolved and pending tickets
Statistics Common Average: Average processing time for resolved and pending tickets
Call - In: Number of tickets created from inbound calls
Call - Out: Number of tickets created from outbound calls
Call - Call Time (In): Total inbound call duration
Call - Call Time (Out): Total outbound call duration
Complete Cases: Number of completed tickets
Average Completion Time: Average time to completion (from initial receipt to final completion)
③ Processing Status by Agent within Time Interval
This section shows the agent’s processing status within each time interval, based on the selected interval unit and end date.
3-2. Chat
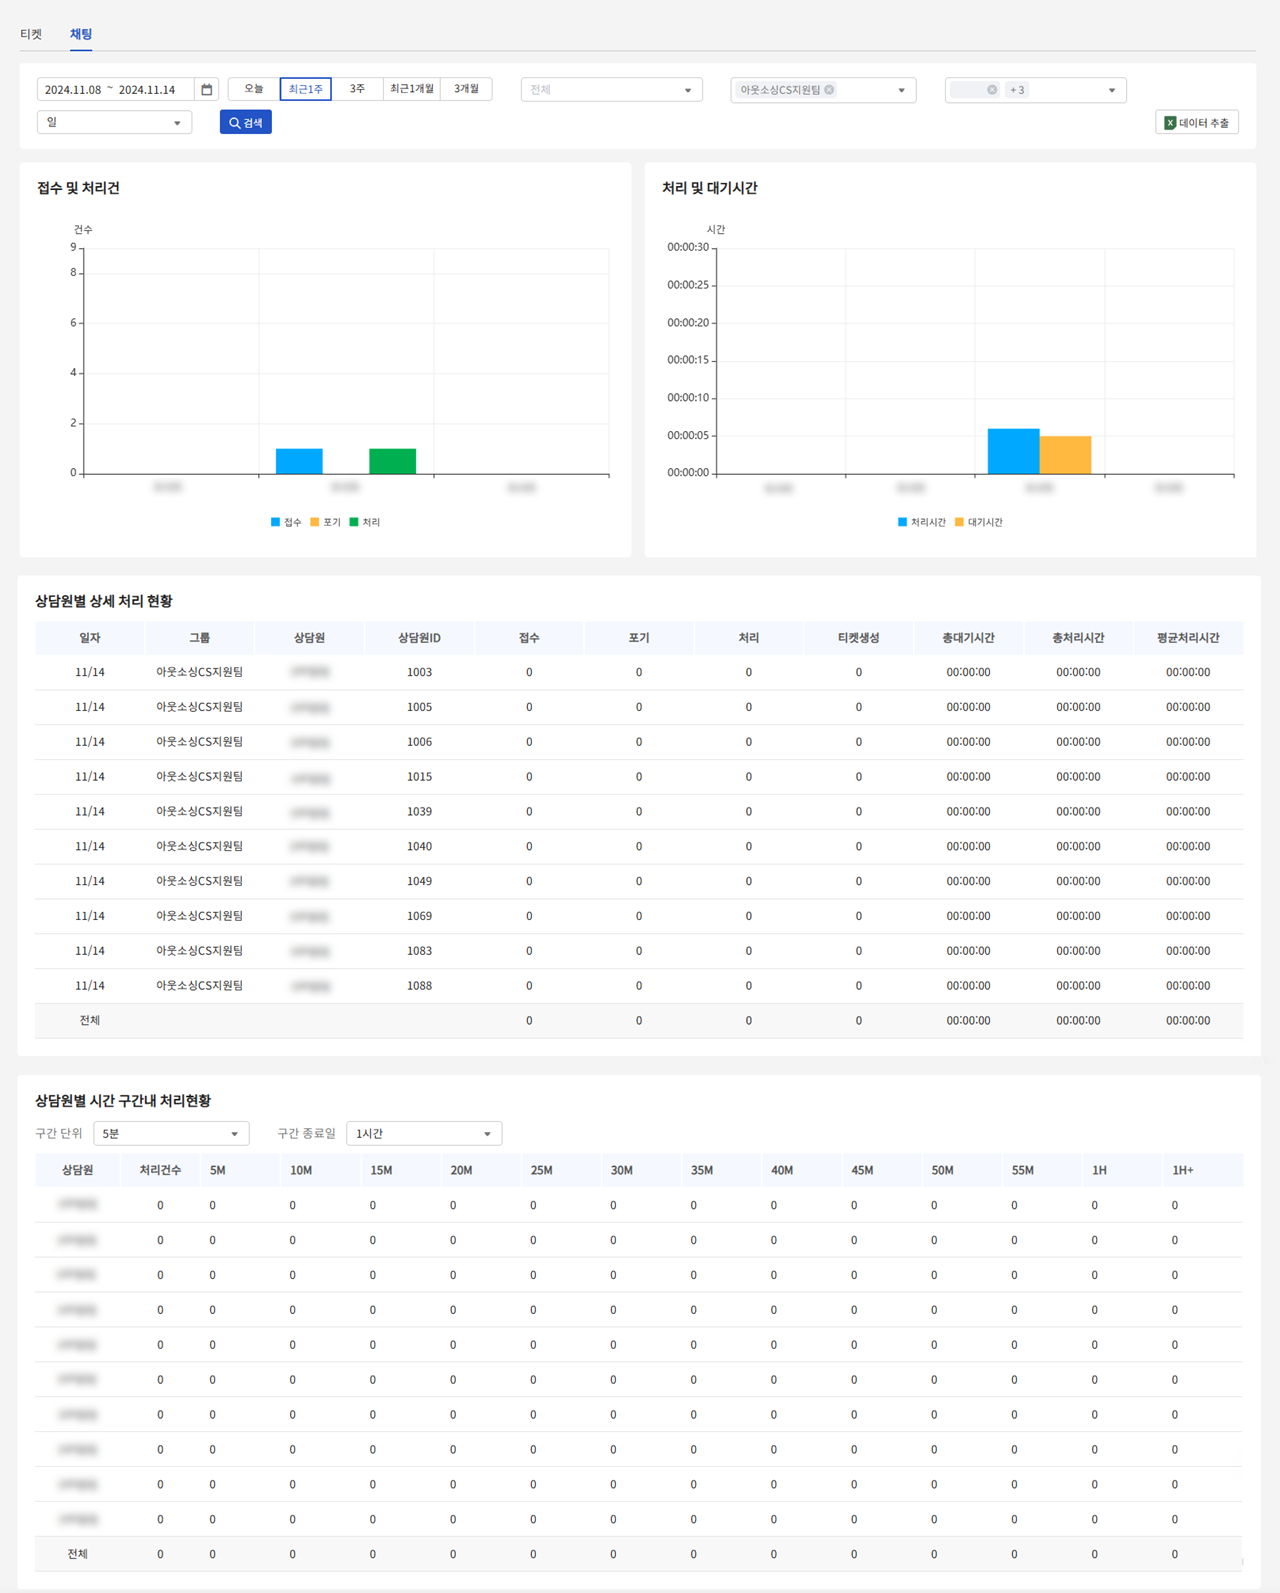
You can view chat consultation statistics by agent, including received and processed cases, processing and waiting times, detailed processing status, and time-interval performance.

① Reception and processing/Processing and waiting time
View the number of received and processed chat consultations, as well as processing and waiting times, based on the selected conditions.
② Processing details by Agent
Check each agent’s detailed processing status according to the selected conditions.
③ Processing details by Agent & Time interval
View each agent’s processing status within time intervals based on the selected conditions.
➍ Ticket Detail History
This menu allows you to view and export ticket intake and processing history.

➐ Transfer Statistics
This menu allows you to view the number of issue transfer tickets, Dooray! transfers, and their average response times.
① Issue Transfer Status
A graph showing the number of tickets currently under transfer and those with completed responses.
Tickets that were retrieved or returned are excluded from the statistics.
Hover over the data points to view detailed figures for each category.
② Average Transfer Answer Time
A graph displaying the average time taken to complete a response after a ticket has been transferred.
Hover over the data points to see the corresponding values.
③ Issue Transfer Details
A table showing detailed information on all issue transfer activities.
Last updated